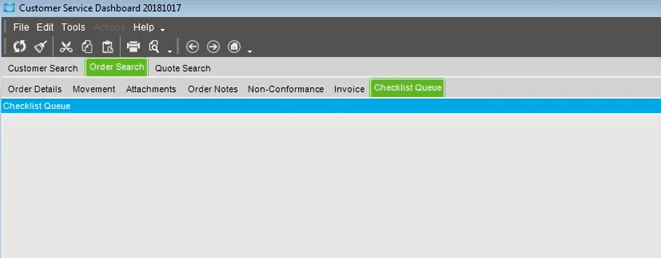
The Dashboards go a little haywire, they try and detect the LastPanel to give it focus. So go to your dashboard and it might take a few attempts, but make sure when you run the dashboard it should load with the focus on the 1st tab! 1st panel
I notice as soon as you launch your customization it re-arranged tabs a bit. That may contribute to it because the MainController tries to detect the LastPanel to give it focus and your focus goes into
then that gets taken away and squeezed into another tab which is probably messing with the PaneActivated and Paint events, try going to the dashboard clicking on tab 1 and hitting save in attempts to refresh the dashboards definition:
Then once its updated Re-Deploy and clear your cache in C:\ProgramData\Epicor
PS: I always struggle with the Layouts in a Dashboard, one wrong click and the entire GridLayout goes Kaboooom! So I ended up modifying it through SQL (Make sure you escape single-ticks ’ find-replace with ‘’)
WARNING: If anyone ever uses this method, make sure you know what you are doing =) also backup your dashboard.
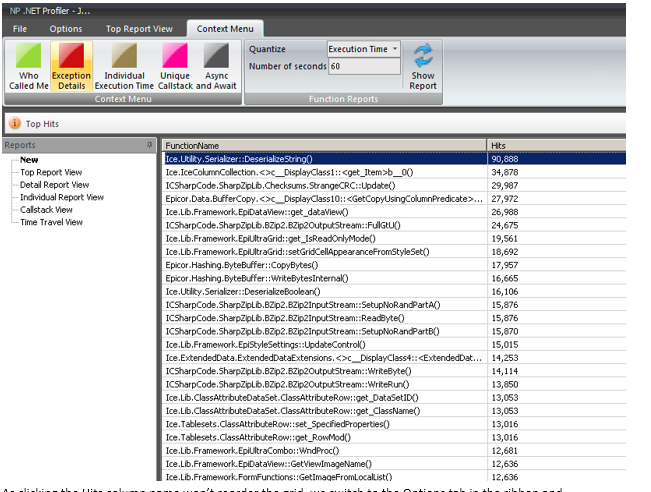
it’ll narrow down to the UI Element how long each took to create itself, paint etc… I am sure @Bart_Elia knows a lil more about NProfiler; I’ve used it vaguely.
Take 30 minutes and go to your Customization and Save it as test by using the File -> Save As …
Then the “test” version - customization you start stripping 1 piece at a time. Example:
Delete a small portion of code / some functionality, save, test it
Repeat chewing away small portions until the “lag” behaviour is gone
Just a process of elimination, and once you hit that “oh its all fast” you might have found the culprit. This includes UI Elements, start deleting 1-5 UI Elements and save, test it, repeat.
@Chris_Conn I wonder if she has a BAQ Combo. But I also believe it could be the Sheets layouts… in 10.2.300 they added a new Property called “Form State” with a choice of Default, Maximized, Minimized and when I pick Maximized - on lets say the Part Form… thing is laggy as hell and you can see it flicker, and load awfully
Wasnt there a guy who had a Form work super slow and it was like a Panel undocked or docked somehow to another monitor, once he removed the docking all was fine. I wonder if something is not docked properly and the form is literally sending 10000s of Redraw, Repaint or Validating Form Events.
I would suggest again, using @josecgomez method called “Banana Peel” start peeling 1 thing away, save, test, peel another thing away, save test… until you literally are back to the base customization (reverse).
Another Issue I had when I added a Customization to a Dashboard is that the Dashboard always wanted to set “FOCUS” to a Child Tab, Advanced Filter and It was such a pain for it not do and sometimes I got object disposed errors, lag, slow choppy behaviour… I gave up and just went to SQL and modified the Dashboard XML and then it didnt try to hijack my Customization on _Load
I have run all of the queries and none of them are erroring out. It is only during the beginning launch that it is slow. Once you launch it and click on each tab to load it, everything runs normal and fast.
It is every custom sheet that loads slowly. There is a video in the beginning of this post where I recorded what it does. There you can see it is literally every custom sheet that takes freaking forever to redraw.
Right, but they all may be loading slowly because of 1 sheet, being a bad apple affecting the whole bunch… so still banana peel every sheet away, 1 at a time.
There is only one query attached to the Base DAshboard. All of the rest of the BAQ’s are Data Views in the Customization or are Dynamic Queries. I had every piece commented out and it still loaded slowly.