I have a customization on a Dashboard which takes about 2 minutes each time you launch it to load all of the customizations. I commented out all of my custom code to prevent it from load and it still took nearly 2 minutes to load. I have three BAQ’s which run the dashboard. I made them allow only one record on load and it still took nearly 2 minutes to load. Any ideas at all? It is each time it loads.
The issue I think is all the stuff you are doing on Initialize:
SetupBrowser_ChecklistQueue();
SetupBrowser_AttachmentListView();
SetupBrowser_Attachments();
SetupBrowser_QuoteLetter();
Just glancing at those, I see a webbrowser loading a webpage. I’d be curious what your performance looks like with that portion disabled.
Okay, yes I do have a previous post about this. I’ll close it.
I also have a lot more information. Using Message Boxes I have narrowed it down to the actual loading of the customized layout I did. My initialize load portion loads really fast - it isn’t actually loading a page there, it is just loading the boxes.
So, it is the sheets I have moved text boxes around and added group boxes and made the layout customized where it is going slow. While it is loading none of my code is firing - I know because I put message boxes in every single portion of it and tracked it.
So you are saying the issue happens BEFORE Initialize runs? What type of performance do you typically get out of your E10? Is it pretty responsive? I’ve certainly never seen it take 5 minutes to load a customization, although with poor performance (network or otherwise), I’ve seen maybe up to 45s to 1m.
If you want to bar none verify there is no effect by code, comment out everything in initialize and destroy. It’s a quick and painless test. If that still gives you the same results I wont argue the point any longer.
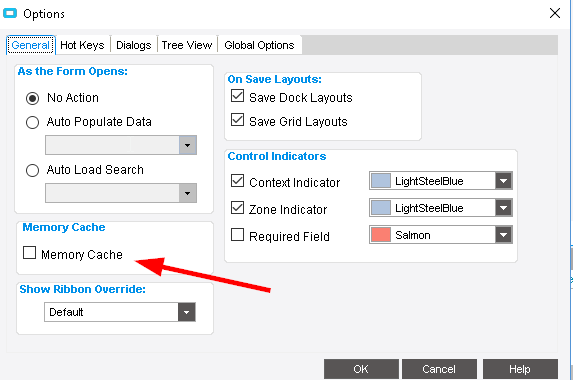
You could also try marking the form (temporarily) memory cached. If performance improves a ton, I think I’d benchmark overall performance. Have you tried on a different machine to rule that out (bad memory/disk/etc on workstation)
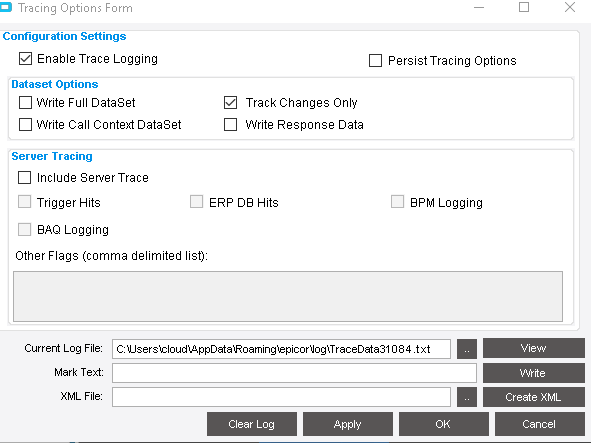
You could also enable tracing before opening, this will give you a view of all the calls being made and how long they are taking to execute. Share that.
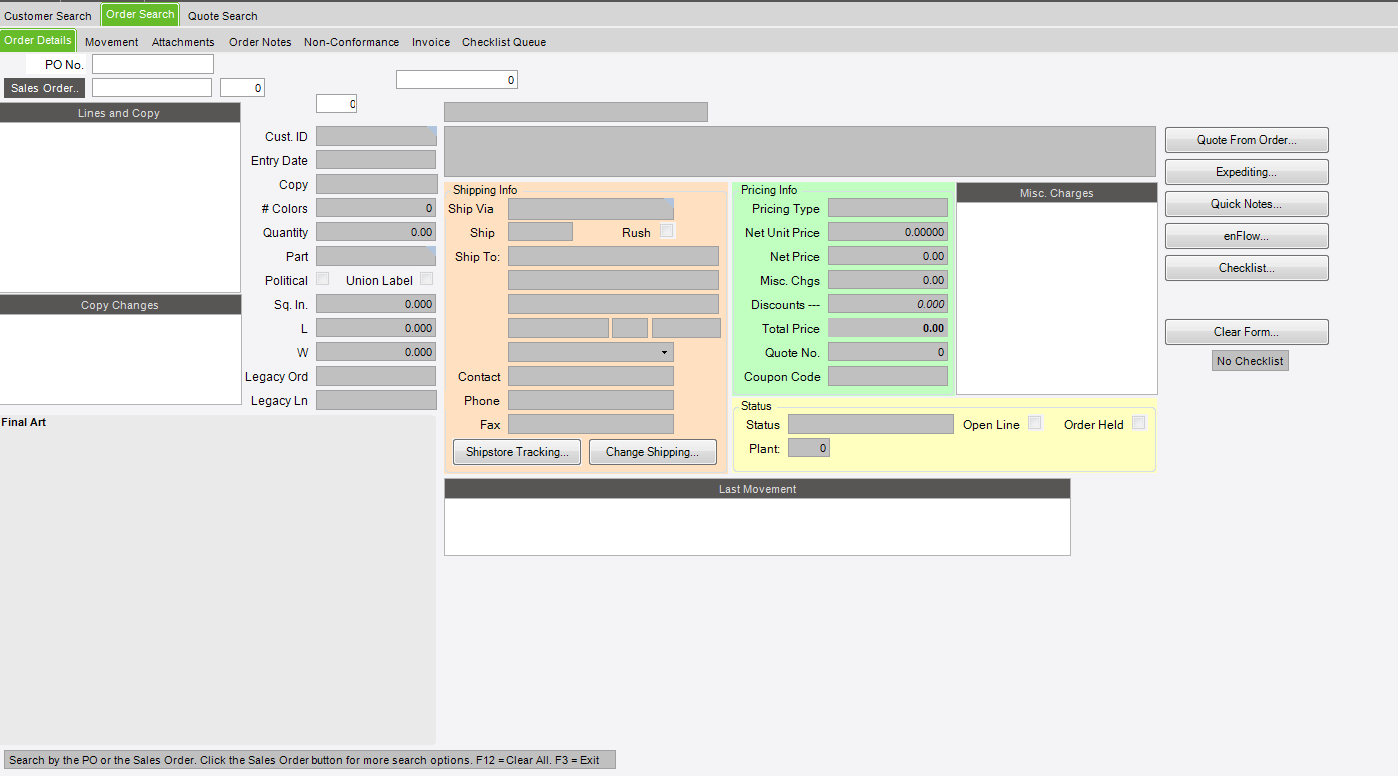
Okay, I commented everything in initialize and destroy out with the same results. Typcially a customized form will load in 15-20 seconds. I have isolated the problem to the actual customized page loading. This is the page that takes the longest. It is taking nearly 45 seconds to load before I can use it. It is pictured here:
In regards to temporarily memory cache…how do I set that? Our IT director has tried it on his machine and a few other users with the same slowness in loading.
The issue you just posted about the hang issue sounds exactly like what is going on. But, It isn’t every customized form. So far, it is just this form…
@Chris_Conn wasn’t there a guy last year that had a form load slow and it had to do with a tab or panel being either pinned to the 2nd monitor or something odd like that. I can’t recall exactly, but it was a odd one.
@hkeric.wci Maybe so, I just skimmed the whole log, like 214 calls, average 35-50ms. That’s only a few seconds of server calls/responses. Must be in the building/drawing of the form.
Yea but with so many calls on this form (how many queries are there?), tracing would probably degrade performance. We could always turn off tracing, hit apply, and run again.
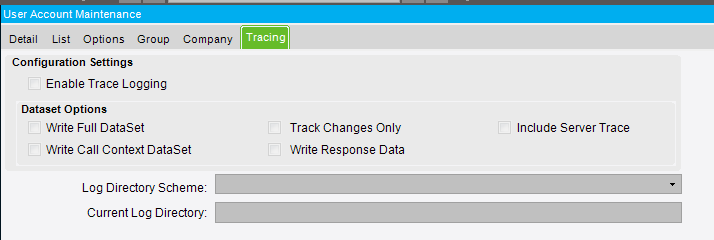
I think there is a way for securitymanagers to place logging on users as well no? @hkeric.wci
There are 25 BAQ’s. I don’t call 23 of them until a button is clicked or a field is left. When I put in my message boxes earlier non of the BAQ’s were ever called on the load.
I can ask my IT Director about the security managers thing. I have no idea. We are still in development mode and haven’t put much into the live environment yet.
I just turned tracing off, changed group boxes to the default with no color and I am getting the same loading/drawing delay. The time to load/draw hasn’t changed thru any of the things I have tried.