I’ve been asked to create some basic sales graphs. Primarily revenue and volume for certain product groups. I’ve done this in the past via the Sales Gross Margin report, but it’s a major pain as it’s a crystal report. I’ve historically manually copied the data into Excel and fought with it to get it into a useable format then sliced and diced to create some graphs(pivot tables)… I’m a bit unsure if I should be looking at shipment tables(e.g. zCustomerShipments), invoice tables, or other for this. Any recommendations?
Edit: In thinking more about this I think doing this by closed jobs might be the easiest from an implementation standpoint, as I’d have less grouping to do. Is there anything wrong with doing this at the job level?
Maybe it’s the accountant in me, but I would want my sales BAQ to always start from a GL table so I can ensure it ties to the ledger and then slice and dice from there.
So…from top to bottom I would use these tables but it’s probably best to figure out what columns you need first and then go get them.
GLJournalDtl
TranGLC
ARInvoice
ShipDtl
OrderDtl
I don’t have a list of tables in front of me so the actual name may be a little different.
Once you have the BAQ you can sure just drop into excel but if you have REST it is nice to link up the BAQ so you can just refresh the workbook. Or, if you use O365, take the data into PowerBI and make some dashboards.
As to your edit, your issue with the doing it at the job level depends on how you use Epicor. If you sell from inventory you wouldnt capture that.
It’s usually a good idea to use the table that directly corresponds to the actual question being asked. In this case if you are looking for shipped revenue, I would use the Ship tables ShipHead and ShipDtl which has pricing info on it. Invoices can sometimes lag. Don’t bother with trying to make graphs in Epicor’s dashboard editor, it’s really underpowered.
If this report will be re-used, it is definitely worth the time to export the query data into Excel via REST instead of copy and pasting. I find that for permanent reports, manually creating the pivot tables using =SumIfs() functions is more stable.
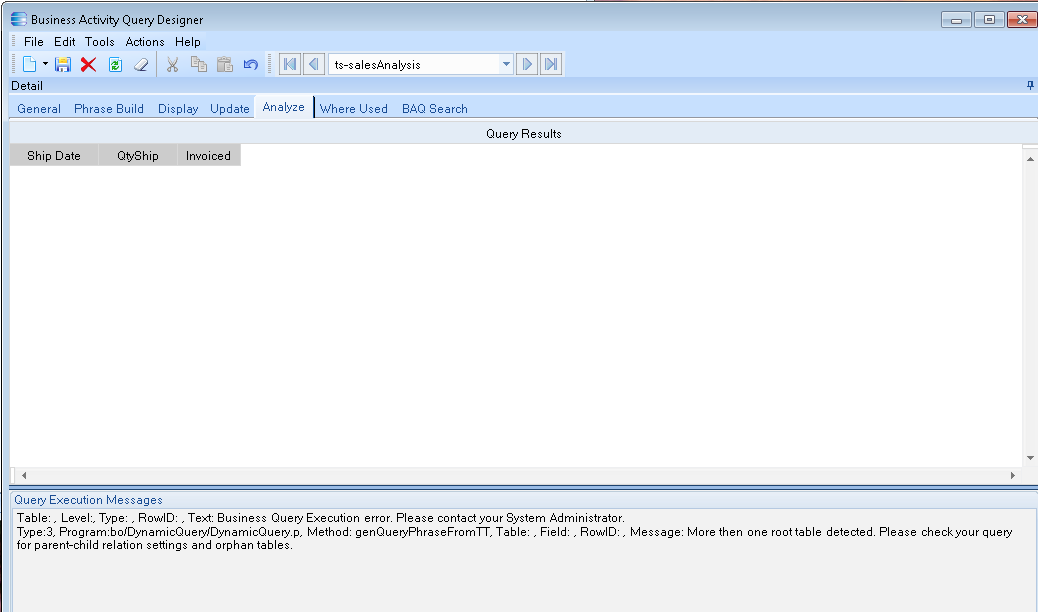
I’m finally getting around to writing the BAQ, and I’m struggling on how to join the InvcDtl table to the ShipHead and ShipDtl tables. I attempted to join ShipDtl and InvcDtl on Company, PackNum, & PackLine, but I’m getting an error “More then one root table detected. Please check your query for parent-child relation settings and orphan tables.”
How do I join the InvcDtl table to ShipHead & ShipDtl tables?
I agree that @Mike has the right approach . Our GM report is super complicated but it should start with collecting the InvcDtl and InvcMsc revenue values to show the expected revenue (from Orderdtl) and actual revenue (from InvcDtl). InvDtl also has TLA and TLE fields for Actual and Estimated Job Costs for shipments that are ‘ship from job’. The other tables mentioned can be used for shipments from stock or other transactions.
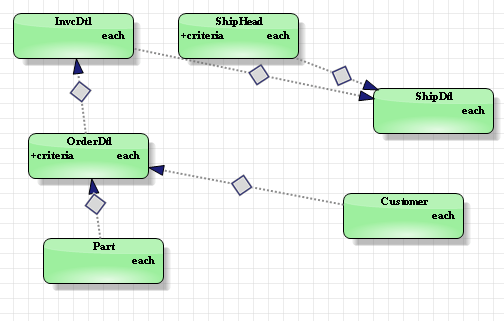
As for your join problem - if those are the only three tables, then the joins are not complete even though they look like it. See the dotted line to InvcDtl - I think that means Epicor doesn’t think it’s a real join, and when you have multiple unjoined tables, you get the error you got.
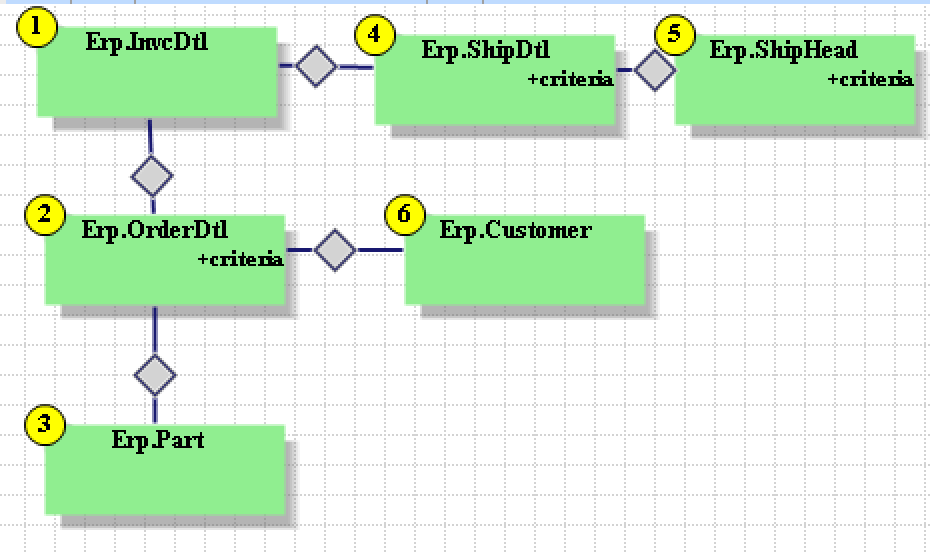
Thanks so much, the joins are now working properly per your suggestions!
In comparing the Sales Gross Margin report to my BAQ I noticed a big discrepancy for qty shipped, and tracked it down to my BAQ listing all components in kits, where Sales Gross Margin doesn’t list components of kits, so I added the OrderDtl table and a criteria of KitQtyPer = 0. I’m now really close, maybe I’m splitting hairs as it’s < 1% difference(Sales Gross Margin vs my BAQ) but that works out to a $38k sales difference one year. I’m looking at the InvcDtl.ExtPrice for total sales price how does that differ from Sales Gross Margin report?
PS we’re not yet analyzing job costs, just really high level sales data. Specifically, how many units did we ship for the quarter and what was the total $ in product we sold for the quarter trended over time…
That’s the beauty of these forums, I’m a newbie so I realize I ask for a lot of help but will do my best to help others with what little I know / have learned
If I sum up all the Costs… I get 534.62, only the Grand Total’s have the proper logic and show 305.34 (which excludes the KitFlag C), however the line level details have the wrong costs. Showing Labor Grand Total vs Summing Labor