That image is messed up. Here is the one taking the longest:

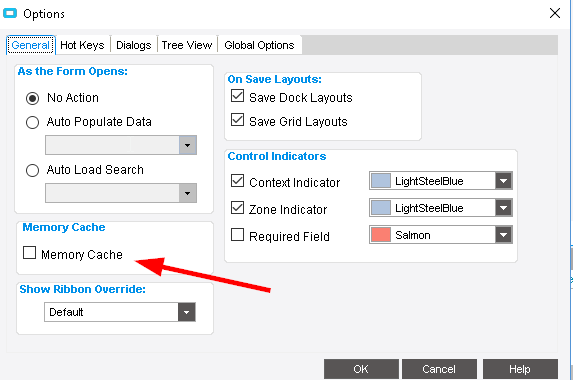
Not that it should make THAT huge of a difference, but I suggest disabling your colors on those groupboxes and trying a load.
How have you determined that page takes the longest time to load if you arent tracing it yet and you said your code isnt running on load?
Right click form, select options, then
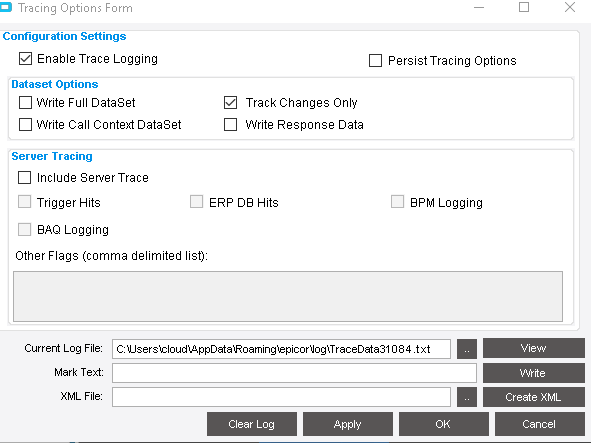
Here is the trace! Weird stuff in there!
I was just timing it with my stopwatch before. All of the Initialize code is commented out in there.
I can’t attach it…it’s too large.
hmmmm… i am wondering if you have the tracing issue described here:
Make sure only enable and track changes only are checked, hit apply, then clear log and try again
The issue you just posted about the hang issue sounds exactly like what is going on. But, It isn’t every customized form. So far, it is just this form…
@Chris_Conn wasn’t there a guy last year that had a form load slow and it had to do with a tab or panel being either pinned to the 2nd monitor or something odd like that. I can’t recall exactly, but it was a odd one.
Hmmm…I do use two monitors.
@hkeric.wci Maybe so, I just skimmed the whole log, like 214 calls, average 35-50ms. That’s only a few seconds of server calls/responses. Must be in the building/drawing of the form.
Yea but with so many calls on this form (how many queries are there?), tracing would probably degrade performance. We could always turn off tracing, hit apply, and run again.
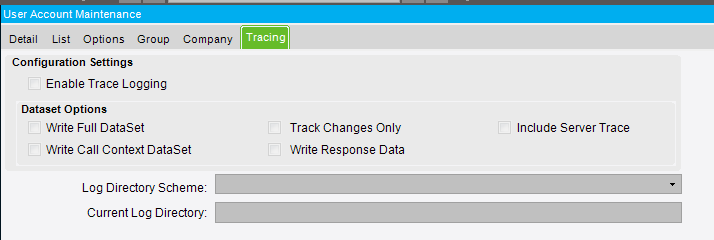
I think there is a way for securitymanagers to place logging on users as well no? @hkeric.wci
There are 25 BAQ’s. I don’t call 23 of them until a button is clicked or a field is left. When I put in my message boxes earlier non of the BAQ’s were ever called on the load.
I can ask my IT Director about the security managers thing. I have no idea. We are still in development mode and haven’t put much into the live environment yet.
I just turned tracing off, changed group boxes to the default with no color and I am getting the same loading/drawing delay. The time to load/draw hasn’t changed thru any of the things I have tried.
When I actually use the form and call the BAQ’s it only takes about 5 seconds for it to run thru the code and show my data.
Bahahah maybe I should have led with this question.That’s a bit excessive, why so many? Do you have a bunch of almost the same queries?
Lol, I take it that is bad… If you have them in a text box leave or click is it bad?
Those are queries attached to the dashboard definition?
I have a only a few that are the same. The reason I have so many is I wanted control of where I could place the grid. There are only three queries which are attached to the dashboard definition.
Well maybe try this to start. Remove all duplicate queries. Once you have a query, you can simple use a grid and copy the epibinding from the first one to view same results.
I didnt look to see if you are using EpiDataViews or not, but you should be. Also, fwiw, you could just use a BAQDataView, search for that, @josecgomez has some good info on it.
Okay, I can try that, but, I just want to say that this was running slow before I used all the dynamic queries during development. I really don’t think that is the issue. I feel like it started when I moved things around.